SimpleOne allows you to create reports using the Report Designer and directly from the data table.
The Report Designer can stop the report generating if the data amount is too large to display. Use the Condition Builder to limit the data sampling or try another type of report.
Create report from list layout
You can create a report via list layout directly from the list view using a table column as the grouping criteria.
Pie and Bar charts are only available for this way of report creating.
To create a report from a table, follow the steps below:
- Navigate to the table you need.
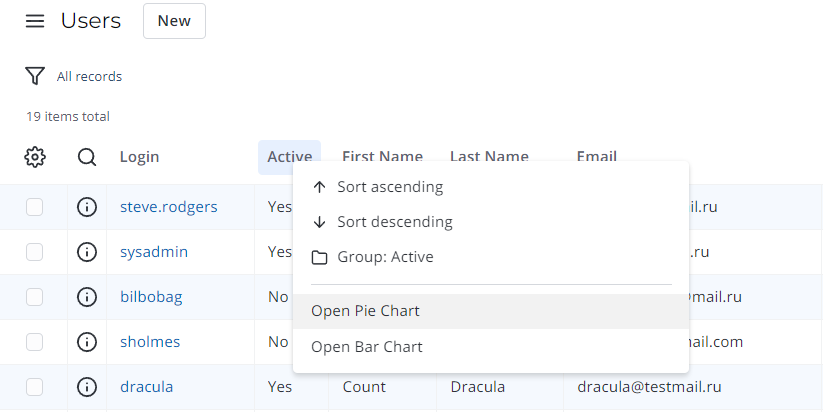
- Click on the table column, which will be a data grouping criteria.
- Select one of the context options:
- Pie Chart – to generate a pie report.
- Bar Chart – to generate a bar report.
- In the Report Designer, customize your report data and style in the tabs.
- Click Refresh to see the changes.
- Click Save to apply changes.
Create reports with Report Designer
- Navigate to the Reports → Create New menu.
- Click Save to apply changes.
To navigate through the Report Designer, use the Back and Next buttons or click on the tabs after filling in the mandatory fields.
Specify report data
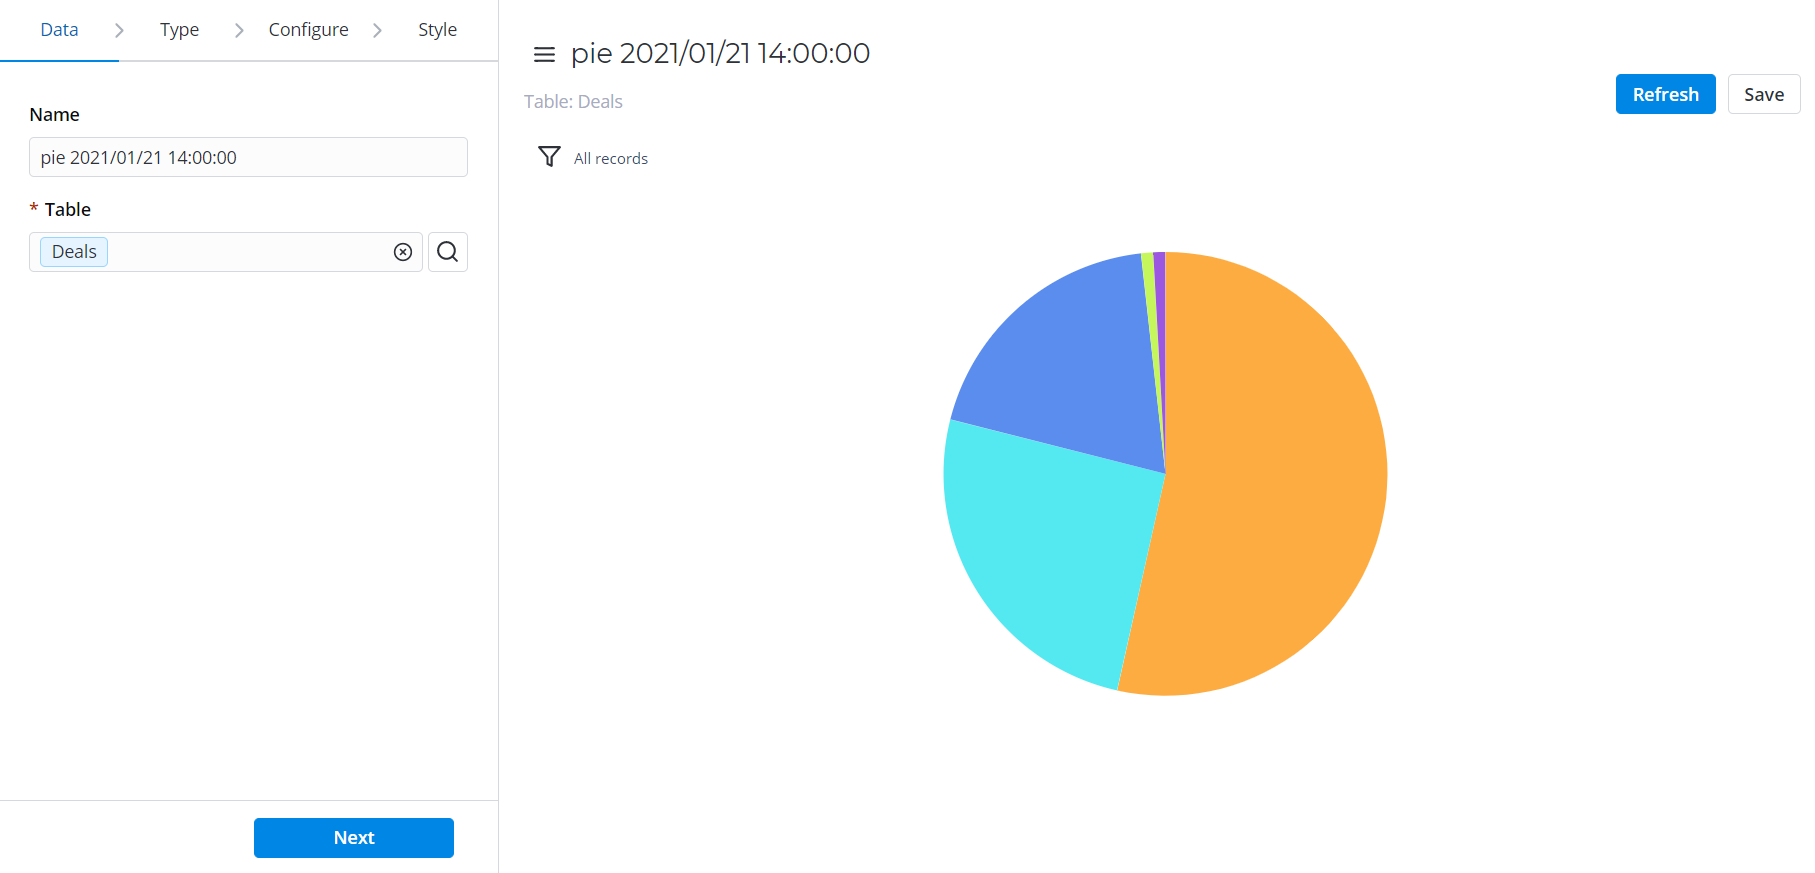
- On the Data tab, fill in the mandatory fields:
- Name – enter the desired name.
- Table – select the table you need.
- Click Next or the Type tab.

Specify report type
- In the Type tab, select a type of your report.
- Click Next or the Configure tab.

Please note that changing existing report type is not allowed. You can create a new record with similar data but of another type instead. To do this, complete the steps below:
- Open the report you need to clone.
- In the hamburger menu on the report form, click Make a copy.
- Specify necessary data, including new type, for the newly created report.
- Click Save to save this report.
Configure report data
In the Configure tab, fill in the fields determined by the report type selected. The reports of the Bars, Pies, Time Series, and Multidimensional category types have mandatory fields.
Use the Condition Builder to establish additional conditions for your report data filtering and grouping. Click the funnel iconto open it.
(Optional) Activate the Add Data Table checkbox to add data in table format to your report.
This option is available for reports of the following types: Bar, Pie, Line, Trends.

(Optional) Set the Aggregation Type and select the Aggregation Column of the source data. The data aggregation allows you to prepare the combined datasets for data processing according to the user needs.
Available Aggregation Type options:
- Average – counts an average number of the column values.
- Count – counts a number of entries.
- Count Distinct – counts the number of unique values of the column.
Sum – counts the sum of the numeric data values in this table column.
The Sum and Average settings make sense if the aggregation column keeps the numeric data.
This option is available for reports of the following types: Bar, Pie, Gauge, Digits, Line, Trends, Pivot Table, Heatmap, Multilevel Pivot Table.

(Optional) Limit the number of data categories displayed with the Groups Limit option. It limits the number of categories specified in the Group by field. Enter the number you want and set the Show Rest as Other checkbox active, if you want to show the categories not included in the limit as the last group.
This option is available for reports of the following types: Bar, Pie, Line, Trends, Pivot Table, Multilevel Pivot Table, Heatmap.

- Click Refresh to generate a report.
Click Next or the Style tab to customize the report style.
- Click Save to save the report.
Customize report style
In the Style tab, configure the style options.
Each report type defines its own style settings.
(Optional) In the General panel, use the Drilldown List Layout option to configure the view of the data slice drilled down. Click the magnifier icon
 and, in the window appeared, select the desired list view of the source table.
See Personal list layout if you want to configure the list view.

- Click Refresh to apply the changes.
- Click Save to save the report.
