ivot Tables Reports represent your data in a table view. The data is aggregated, grouped, and analyzed basing on two metrics.
| Tip |
|---|
This report view is useful for issues of comparing, summarizing, and counting a large amount of data. |

Create a pivot table report
Use Report Designer to create, configure, and style pivot tables reports.
| Panel | ||||
|---|---|---|---|---|
| ||||
|

Configure the data Anchor configure the data pivot report configure the data pivot report
| configure the data pivot report | |
| configure the data pivot report |
To configure a report, follow the steps below:
- On the Configure tab, specify the report dataset.
- Click Refresh to build the report.
- Click Save to save the report.
| Info |
|---|
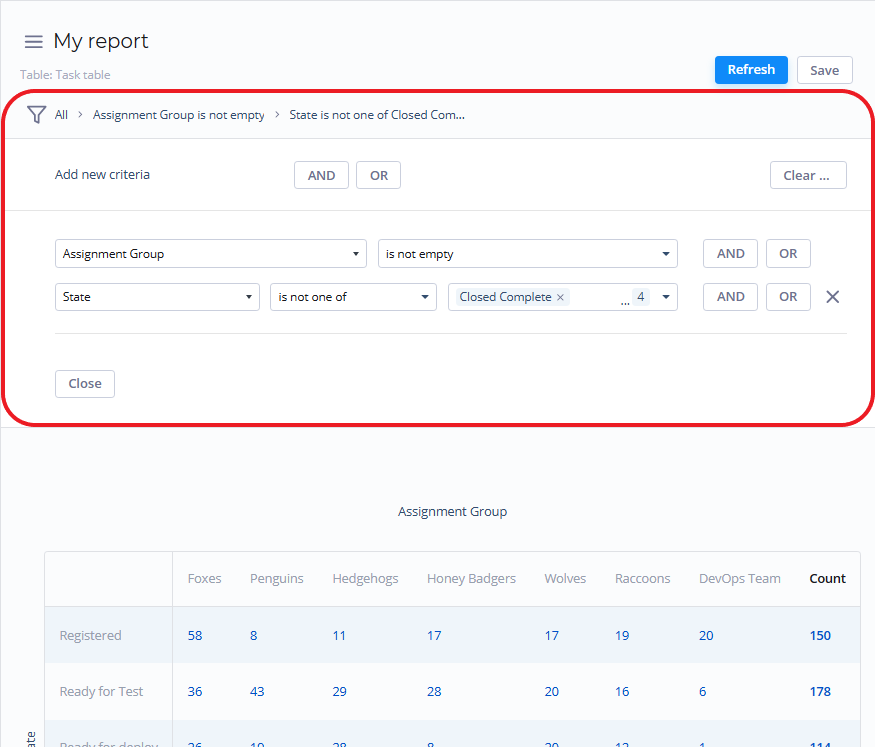
Use the Condition Builder to establish additional conditions for data filtering and grouping.
 |
The Configure tab fields
| Anchor | ||||
|---|---|---|---|---|
|
| Field | Mandatory | Description | ||
|---|---|---|---|---|
| Column | Y | Set the desired table column as a column for the pivot table report. | ||
| Row | Y | Set the desired table column as a row for the pivot table report. | ||
| Aggregation Type | N | Select the data aggregation to create combined datasets for data processing. Available options:
The aggregation option selected is applied to the table column set in the Aggregation Column field. | ||
| Aggregation Column | N | Select a table column with numeric values for data aggregation.
| ||
| Groups Limit | N | Define the limit of the data groups shown in your report. | ||
| Show Rest as Other | N | Select this checkbox to show the data groups not included in Groups Limit as one.
|
Use the Condition Builder to establish additional conditions for your report data filtering and grouping.
Customize the style Anchor customize the style pivot table customize the style pivot table
| customize the style pivot table | |
| customize the style pivot table |
You can configure the report look and multilevel pivot table score colors in any way you want with the style settings.
To customize a report style, follow the steps below:
- On the Style tab of your report, configure the settings.
- Click Refresh to apply the changes.
- Click Save to save the report.
Add title and customize the data list and table views with the settings below.
The Style tab fields
| General | ||||
|---|---|---|---|---|
| Field | Mandatory | Description | ||
| Drilldown List Layout | N | Use this option to configure the view of the data slice drilled down. Click the magnifier icon
| ||
| Decimal Precision | N | Define how many numbers should be displayed after the point of numeric data values in your chart.
| ||
| Title | ||||
| Field | Mandatory | Description | ||
| Report Title Show Type | N | Select the type for the report title showing. Available options:
| ||
| Report Title | N | Specify the title of the report you create. | ||
| Report Title Size | N | Specify the number of pixels to set the size of the report title. | ||
| Report Title Color | N | Select the color of the report title. Click the magnifier icon | ||
| Title Alignment | N | Select the alignment of the report title. Available options:
| ||
| Bold Title | N | Select this checkbox to make the chart title bold. | ||
| Table of Contents | ||||||||
|---|---|---|---|---|---|---|---|---|
|