Make simple reports with Digit Reports provide a digit representation of a single metric value. These charts are
| Tip |
|---|
This report view is useful for monitoring the critical parameters by clear visual presentation. |


Create a digit report Anchor specified table specified table
| specified table | |
| specified table |
Use Report Designer to create, configure, and style digit reports.
| Panel | ||||
|---|---|---|---|---|
| ||||
|

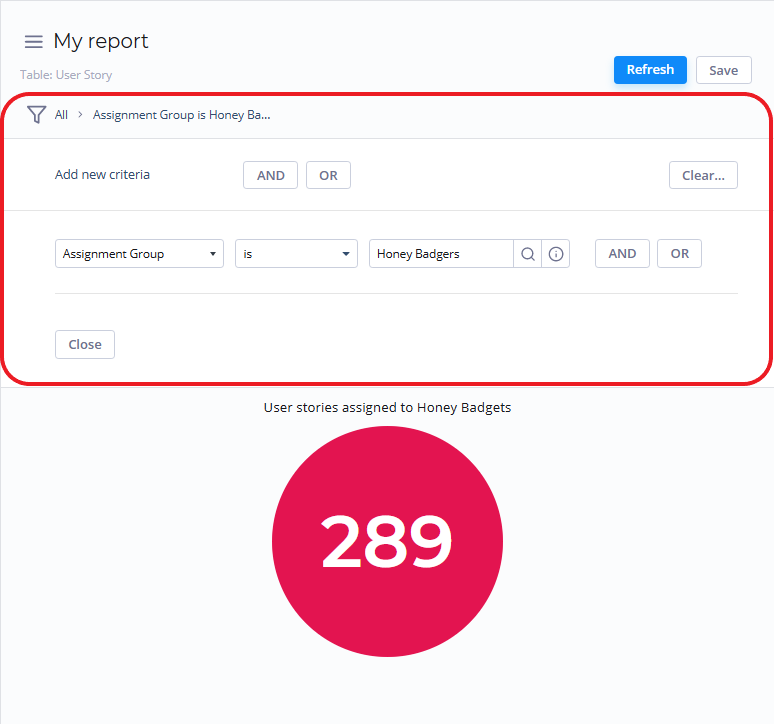
Configure the data Anchor configure the data digit report configure the data digit report
| configure the data digit report | |
| configure the data digit report |
To configure a report, follow the steps below:
- On the Configure tab, specify the report dataset.
- Click Refresh to build the report.
- Click Save to save the report.
| Info |
|---|
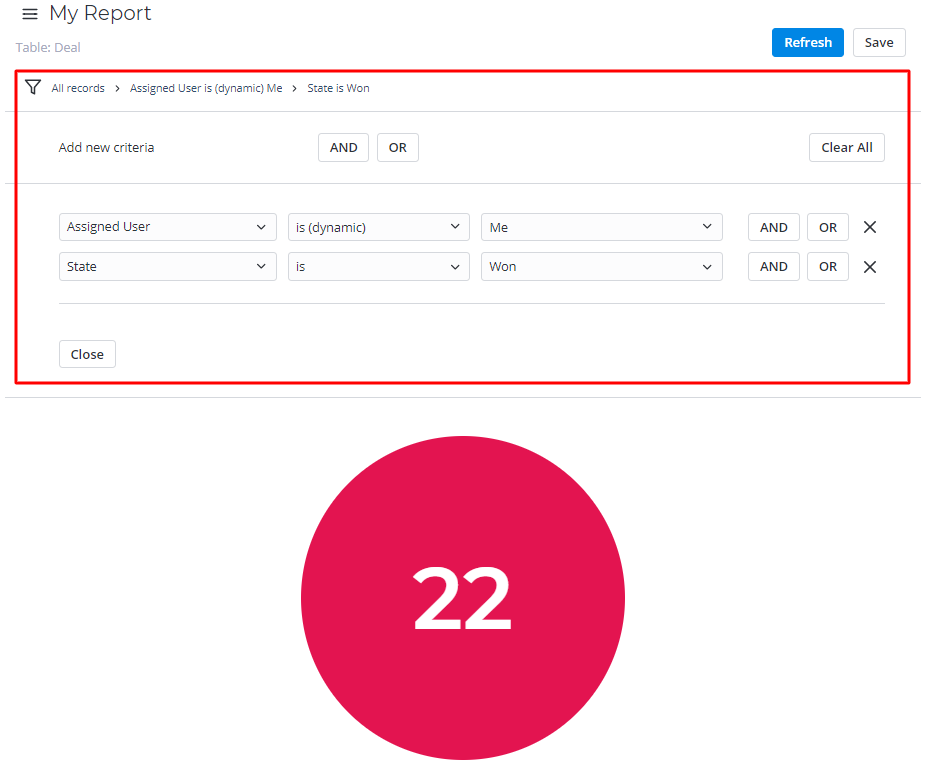
Use the the Condition Builder to to establish additional conditions for data filtering and grouping.
 |
Fill in these fields to configure your report in a way you want.
The Configure tab fields
 |
The Configure tab fields Anchor configure tab fields bar digit report configure tab fields bar digit report
| configure tab fields bar digit report | |
| configure tab fields bar digit report |
Field | Mandatory | Description |
|---|---|---|
| Aggregation Type | N | Select the data aggregation to create |
Field
Description
combined datasets for data processing |
. Available options:
|
|
|
|
|
The aggregation option selected is applied to the table column set in the Aggregation |
Column field. |
| Aggregation |
| Column | Y | Select a table column with numeric values for data aggregation.
|
|
|
Customize the style Anchor customize the style digit report customize the style digit report
| customize the style digit report | |
| customize the style digit report |
You can configure the report look and digit score colors in any way you want using the style settings.
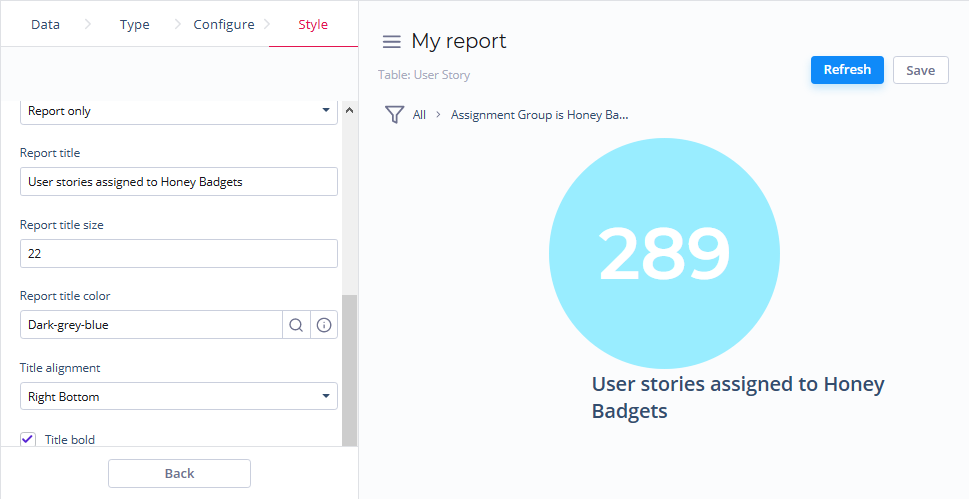
To customize a report style, follow the steps below:
- On the Style tab of your report, configure the settings.
- Click Refresh to apply the changes.
- Click Save to save the report.

Change colors, add titles, and customize the data list and table views with the settings below.
The Style tab fields
| General |
|---|
| Field | Mandatory | Description |
|---|---|---|
| Drilldown | ||
| List Layout | N | Use this option to configure the view of the data slice drilled down. Click the magnifier icon |
| ||
| Decimal |
| Precision | N | Define how many |
numbers should be displayed after the point of numeric data values in your chart.
| ||
| Color | N | Set the color for your digit chart. |
Click the magnifier icon | ||
| Title | ||
|---|---|---|
| Field | Mandatory | Description |
| Report Title Show Type | N | Select |
the type for the report title showing. |
Available options: |
|
|
|
| Report |
| Title | N |
| Specify the title of the report you create. |
| Report |
| Title Size | N | Specify |
| the number of pixels to set the size of the report title. |
| Report |
| Title Color | N | Select the color of the report title. Click the magnifier icon |
| Title |
| Alignment | N |
Select the alignment of the chart title selecting one of these options:
|
|
|
|
|
|
|
|
| Bold Title |
| N |
| Select this checkbox |
| to make the chart title bold. |
| Table of Contents | ||||||||
|---|---|---|---|---|---|---|---|---|
|