Report types
...
...
...
...
...
...
Create a Pie Report
.
| Expand | ||||||||||||||||||||||||||||||||||||||||||||||||||||||||||||||||||||||||||||||||||||||||||||||||||||||||||||||||||||||||||||||||||||||||||||||||
|---|---|---|---|---|---|---|---|---|---|---|---|---|---|---|---|---|---|---|---|---|---|---|---|---|---|---|---|---|---|---|---|---|---|---|---|---|---|---|---|---|---|---|---|---|---|---|---|---|---|---|---|---|---|---|---|---|---|---|---|---|---|---|---|---|---|---|---|---|---|---|---|---|---|---|---|---|---|---|---|---|---|---|---|---|---|---|---|---|---|---|---|---|---|---|---|---|---|---|---|---|---|---|---|---|---|---|---|---|---|---|---|---|---|---|---|---|---|---|---|---|---|---|---|---|---|---|---|---|---|---|---|---|---|---|---|---|---|---|---|---|---|---|---|---|
| ||||||||||||||||||||||||||||||||||||||||||||||||||||||||||||||||||||||||||||||||||||||||||||||||||||||||||||||||||||||||||||||||||||||||||||||||
Configure tab
Style tab
| ||||||||||||||||||||||||||||||||||||||||||||||||||||||||||||||||||||||||||||||||||||||||||||||||||||||||||||||||||||||||||||||||||||||||||||||||
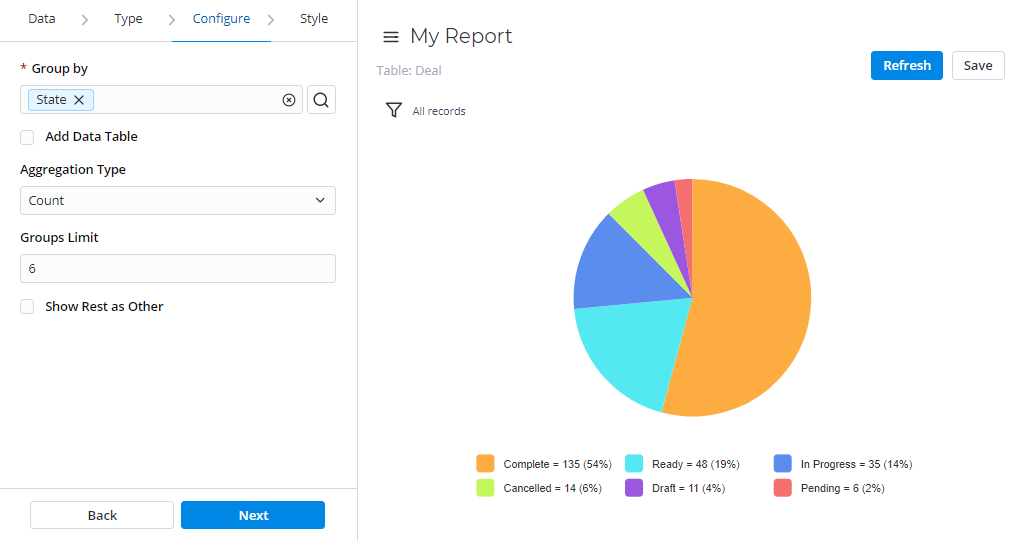
Pie
Pie reports display data in the form of a circular graph divided into slices. Each slice proportionally displays
...
...
...
Create a Gauge Report
...
. The pie chart is the most obvious choice when the number of categories is small.
| Expand | ||||||||||||||||||||||||||||||||||||||||||||||||||||||||||||||||||||||||||||||||||||||||||||||
|---|---|---|---|---|---|---|---|---|---|---|---|---|---|---|---|---|---|---|---|---|---|---|---|---|---|---|---|---|---|---|---|---|---|---|---|---|---|---|---|---|---|---|---|---|---|---|---|---|---|---|---|---|---|---|---|---|---|---|---|---|---|---|---|---|---|---|---|---|---|---|---|---|---|---|---|---|---|---|---|---|---|---|---|---|---|---|---|---|---|---|---|---|---|---|
| ||||||||||||||||||||||||||||||||||||||||||||||||||||||||||||||||||||||||||||||||||||||||||||||
Configure tab
Style tab
| ||||||||||||||||||||||||||||||||||||||||||||||||||||||||||||||||||||||||||||||||||||||||||||||
Gauge
Gauge reports present a single metric value from the data via the gauge panel with a dial on it.
This report view is useful for evaluating the criticality according to the established limits.

| Expand | ||||||||
|---|---|---|---|---|---|---|---|---|
| ||||||||
Configure tab
|
...
Create a Digit Report
...
Style tab
| |||||||||||||||||||||||||||||||||||||||||||||||||||||||||||||||||||||||||
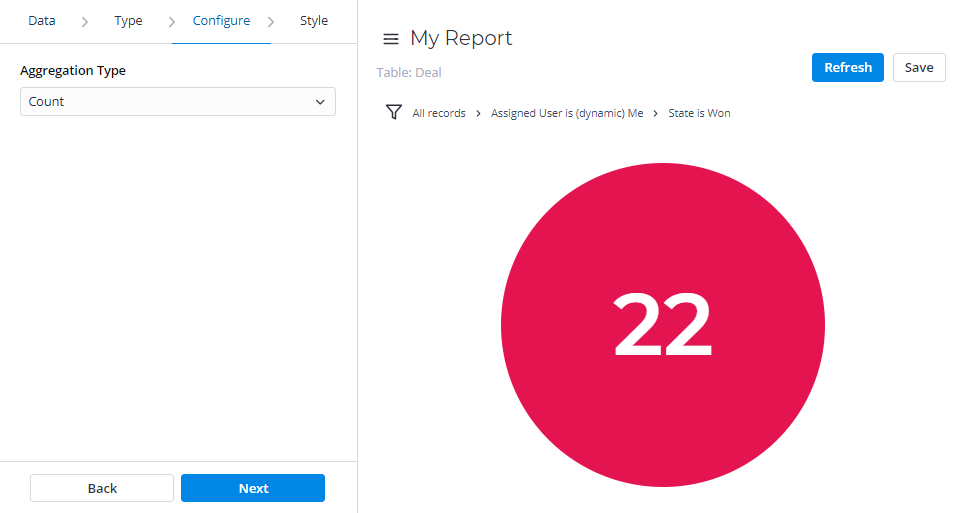
Digit
Digit reports provide a simple digit representation of a single metric value.
This report view is useful for monitoring the critical parameters by using a clear visual presentation.
| Expand | ||||||
|---|---|---|---|---|---|---|
| ||||||
Configure tab
|
...
Create a Line Report
Style tab
| |||||||||||||||||||||||||||||||||||||||||||||||||||
Line
Line reports present
...
...
...
Create a Pivot Table Report
Pivot Reports represent your data in a table view with aggregating, grouping, and analyzing using two metrics as row and column for your chart.
This report view is useful for issues of comparing, summarizing, and counting a large amount of data.
Create a Multilevel Pivot Table Report
Pivot Tables Reports represent your data in a table view. The data is aggregated, grouped, and analyzed basing on two metrics (as row and column).
| Expand | |||||||||||||||||||||||||||||||||||||||||||||||||||||||||||||||||||||||||||||||||||||||||||||||||||||||||||||||||||||||||||||||||||||||||||||||||||||||||||||||||||
|---|---|---|---|---|---|---|---|---|---|---|---|---|---|---|---|---|---|---|---|---|---|---|---|---|---|---|---|---|---|---|---|---|---|---|---|---|---|---|---|---|---|---|---|---|---|---|---|---|---|---|---|---|---|---|---|---|---|---|---|---|---|---|---|---|---|---|---|---|---|---|---|---|---|---|---|---|---|---|---|---|---|---|---|---|---|---|---|---|---|---|---|---|---|---|---|---|---|---|---|---|---|---|---|---|---|---|---|---|---|---|---|---|---|---|---|---|---|---|---|---|---|---|---|---|---|---|---|---|---|---|---|---|---|---|---|---|---|---|---|---|---|---|---|---|---|---|---|---|---|---|---|---|---|---|---|---|---|---|---|---|---|---|---|
| |||||||||||||||||||||||||||||||||||||||||||||||||||||||||||||||||||||||||||||||||||||||||||||||||||||||||||||||||||||||||||||||||||||||||||||||||||||||||||||||||||
Configure tab
Style tab
| |||||||||||||||||||||||||||||||||||||||||||||||||||||||||||||||||||||||||||||||||||||||||||||||||||||||||||||||||||||||||||||||||||||||||||||||||||||||||||||||||||
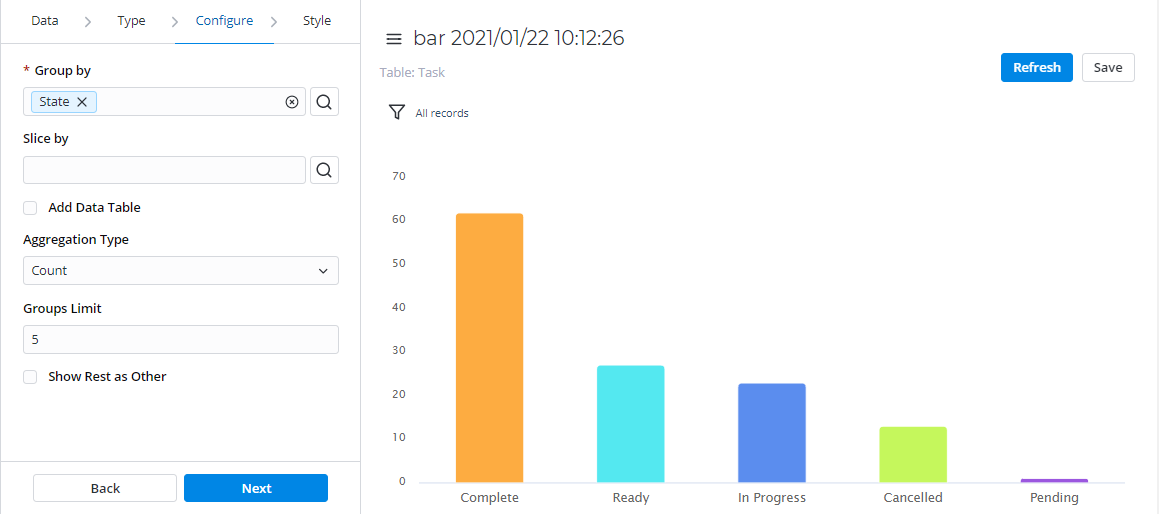
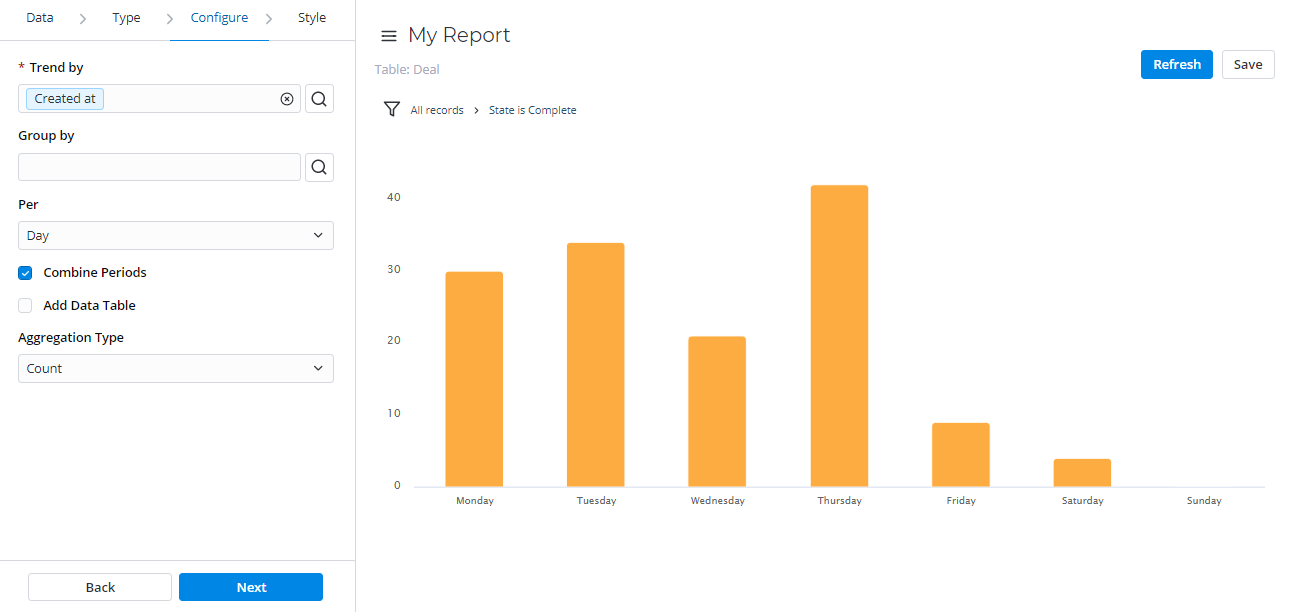
Trend
Trend reports show the dynamics of data changes. The data is presented in the form of columns divided by periods of time.
This report type is useful for monitoring time parameters.
| Expand | ||||||||||||||||||||||||||||||||||||||||||||||||||||||||||||||||||||||||||||||||||||||||||||||||||||||||||||||||||||||||||||||||||||||||||||||||||||
|---|---|---|---|---|---|---|---|---|---|---|---|---|---|---|---|---|---|---|---|---|---|---|---|---|---|---|---|---|---|---|---|---|---|---|---|---|---|---|---|---|---|---|---|---|---|---|---|---|---|---|---|---|---|---|---|---|---|---|---|---|---|---|---|---|---|---|---|---|---|---|---|---|---|---|---|---|---|---|---|---|---|---|---|---|---|---|---|---|---|---|---|---|---|---|---|---|---|---|---|---|---|---|---|---|---|---|---|---|---|---|---|---|---|---|---|---|---|---|---|---|---|---|---|---|---|---|---|---|---|---|---|---|---|---|---|---|---|---|---|---|---|---|---|---|---|---|---|---|
| ||||||||||||||||||||||||||||||||||||||||||||||||||||||||||||||||||||||||||||||||||||||||||||||||||||||||||||||||||||||||||||||||||||||||||||||||||||
Confugure tab
Style tab
| ||||||||||||||||||||||||||||||||||||||||||||||||||||||||||||||||||||||||||||||||||||||||||||||||||||||||||||||||||||||||||||||||||||||||||||||||||||
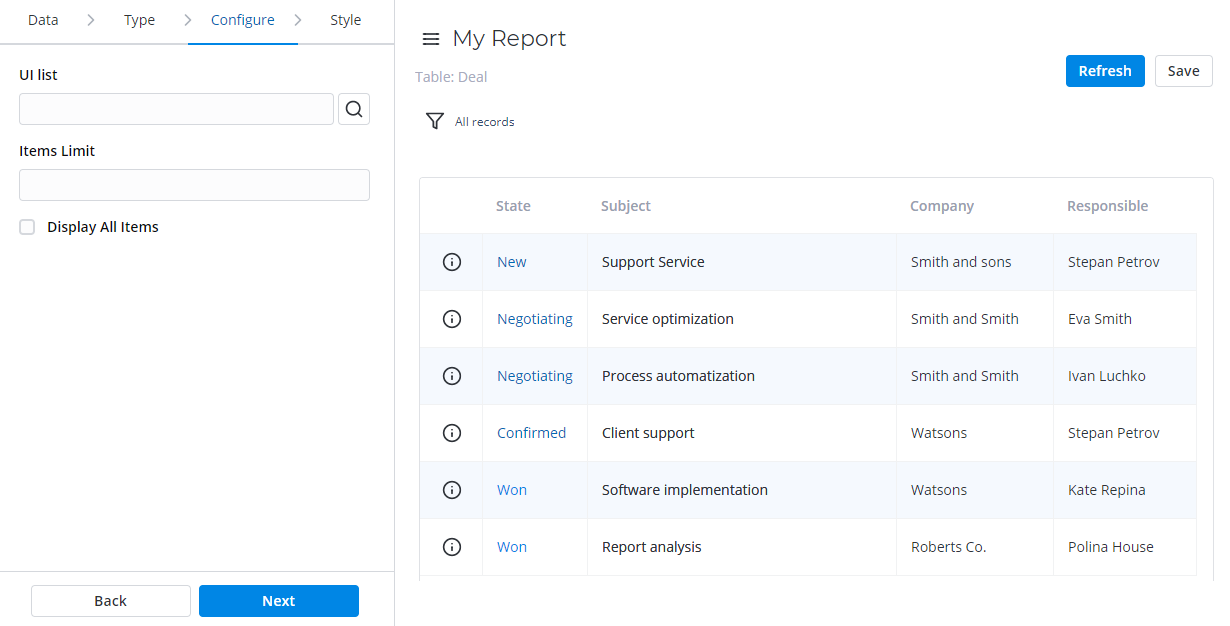
List
List reports represent table data in the form of a list view.
| Expand | ||||||||||||||||||||||||||||||||||||
|---|---|---|---|---|---|---|---|---|---|---|---|---|---|---|---|---|---|---|---|---|---|---|---|---|---|---|---|---|---|---|---|---|---|---|---|---|
| ||||||||||||||||||||||||||||||||||||
Configure tab
Style tab
| ||||||||||||||||||||||||||||||||||||
Pivot Table
Pivot reports present your data in the form of a table view. The data is analyzed, aggregated, and grouped based on two metrics (as rows and columns).
This report view is useful for comparing
...
, summarizing, and counting a large amount of data.
| Expand | ||||||
|---|---|---|---|---|---|---|
| ||||||
Configure tab
|
...
Create a List Report
List Reports represent table data in a list view.
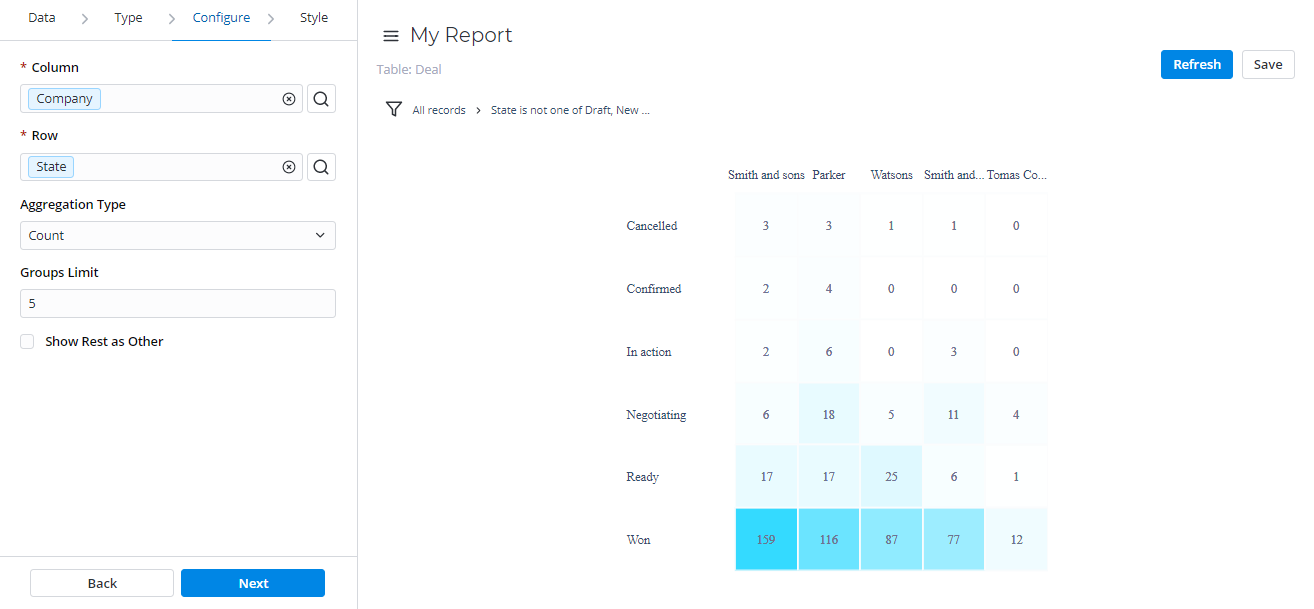
Create a Heatmap Report
Style tab
| ||||||||||||||||||||||||||||||||||||||||||||||||||||||||||||||
Heatmap
Heatmap reports
...
...
different color shades.
| Expand | ||||||||||||||||||||||||||||||||||||||||||||||||||||||||||||||||||||||||||||||||||||||||
|---|---|---|---|---|---|---|---|---|---|---|---|---|---|---|---|---|---|---|---|---|---|---|---|---|---|---|---|---|---|---|---|---|---|---|---|---|---|---|---|---|---|---|---|---|---|---|---|---|---|---|---|---|---|---|---|---|---|---|---|---|---|---|---|---|---|---|---|---|---|---|---|---|---|---|---|---|---|---|---|---|---|---|---|---|---|---|---|---|
| ||||||||||||||||||||||||||||||||||||||||||||||||||||||||||||||||||||||||||||||||||||||||
Configure tab
Style tab
| ||||||||||||||||||||||||||||||||||||||||||||||||||||||||||||||||||||||||||||||||||||||||
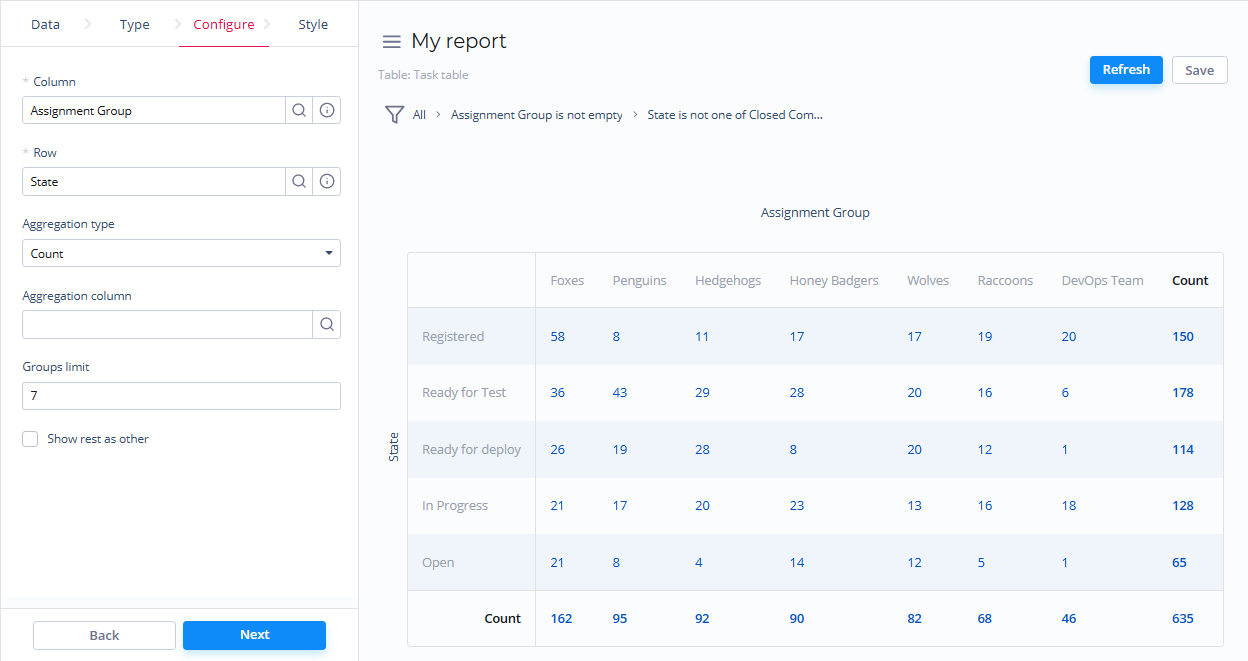
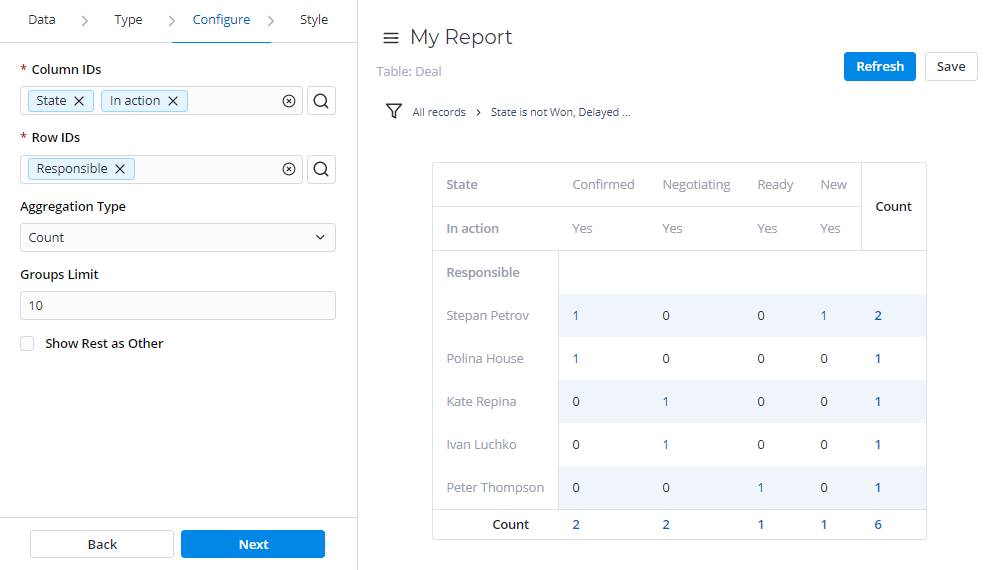
Multilevel Pivot Table
Multilevel Pivot Tables reports represent your data in the form a table view. The data is aggregated, grouped, and analyzed based on two metrics (as rows and columns).
This report view is extremely useful for comparing, summarizing, and counting a large amount of data.
| Expand | |||||||||||||||||||||||||||||||||||||||||||||||||||||||||||||||||||
|---|---|---|---|---|---|---|---|---|---|---|---|---|---|---|---|---|---|---|---|---|---|---|---|---|---|---|---|---|---|---|---|---|---|---|---|---|---|---|---|---|---|---|---|---|---|---|---|---|---|---|---|---|---|---|---|---|---|---|---|---|---|---|---|---|---|---|---|
| |||||||||||||||||||||||||||||||||||||||||||||||||||||||||||||||||||
Configure tab
Style tab
| |||||||||||||||||||||||||||||||||||||||||||||||||||||||||||||||||||
| Table of Contents | ||||||
|---|---|---|---|---|---|---|
|
...
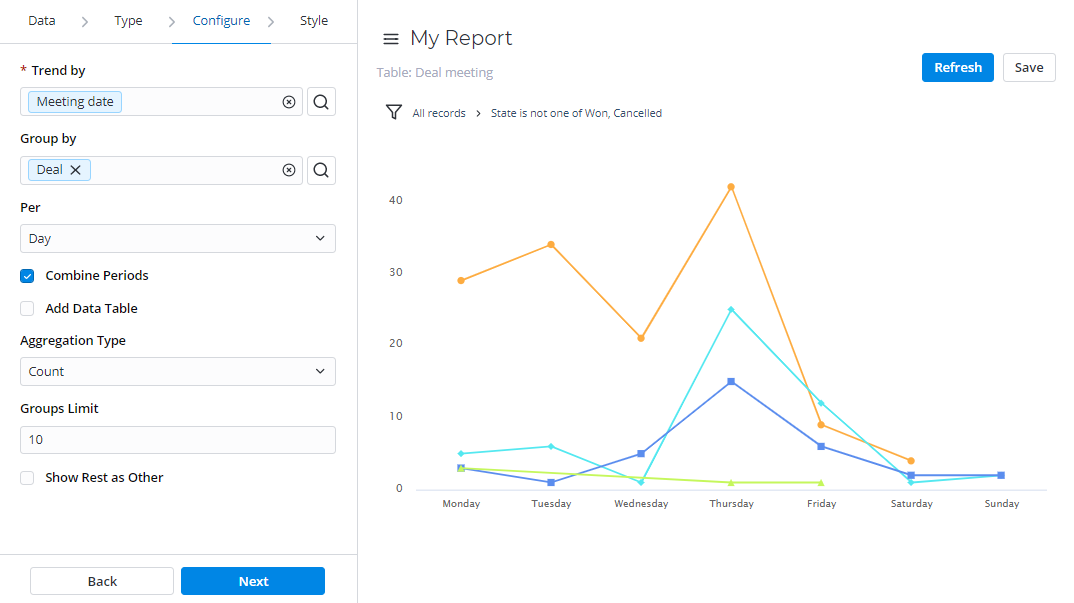
Create a Trend Report
Trend reports show the dynamics of data changes. The data is represented as columns over periods.
...