SimpleOne allows you to create reports using the Report Designer and directly from the data table.
| Note |
|---|
The Report Designer can stop the report generating if the data amount is too large to display. Use the Condition Builder to limit the data sampling or try another type of report. |
Create report from list layout
You can create a report via list layout directly from the list view using a table column as the grouping criteria.
| Info |
|---|
Pie and Bar charts are only available for this way of report creatingcreation. |
To create a report from a the table, follow the steps below:
- Navigate to the table you need.
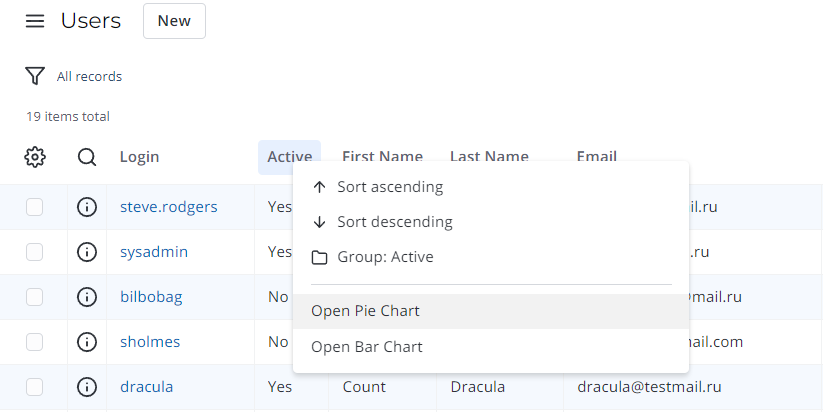
- Click on the table column, which will be a data grouping criteria.
- Select one of the context options:
- Pie Chart – to generate a pie report.
- Bar Chart – to generate a bar report.
- In the Report Designer, customize your report data and its style in the tabs.
- Click Refresh to see the changes.
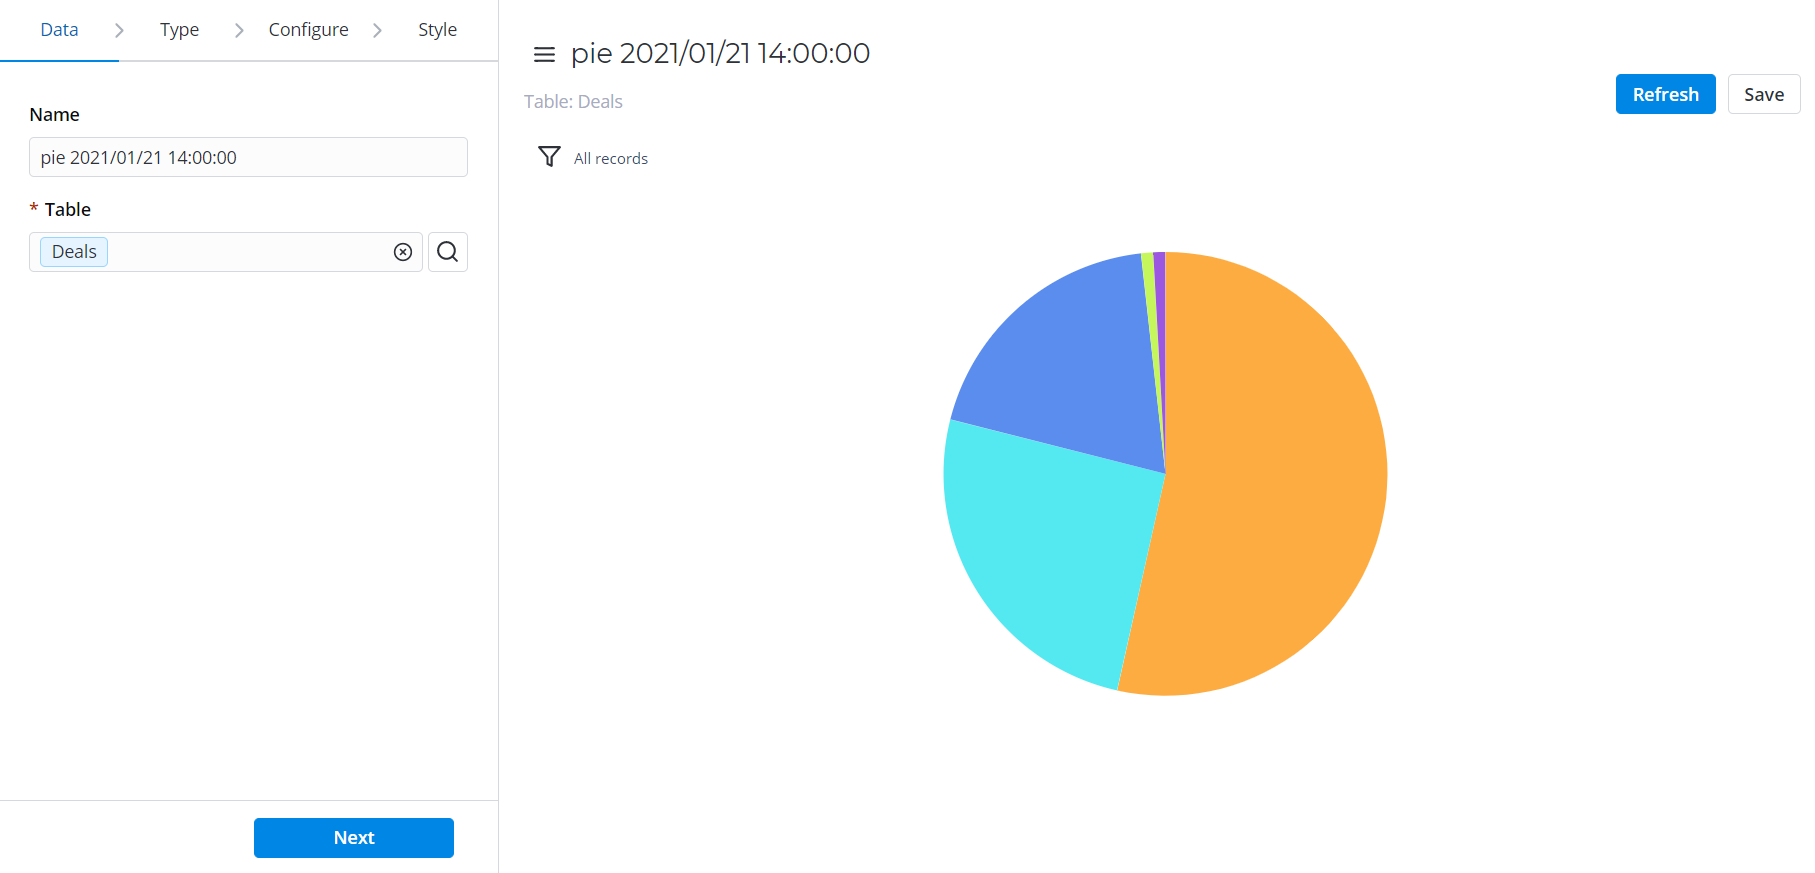
- Click Save to apply changes.
Create reports with Report Designer
- Navigate to the Reports → Create New menu.
- Click Save to apply changes.
| Info |
|---|
To navigate through the Report Designer, use the Back and Next buttons or click on the tabs after filling in the mandatory fields. |
| Anchor | ||||
|---|---|---|---|---|
|
| Panel | ||
|---|---|---|
| ||
|

| Anchor | ||||
|---|---|---|---|---|
|
| Panel | ||
|---|---|---|
| ||
|

| Note |
|---|
Please note Note that changing the existing report type is not allowed. You can create a new record with similar data but of another type instead. To do this, complete the steps below:
|
| Anchor | ||||
|---|---|---|---|---|
|
| Panel | ||||||||||||
|---|---|---|---|---|---|---|---|---|---|---|---|---|
| ||||||||||||
|


| Anchor | ||||
|---|---|---|---|---|
|
| Panel | ||||
|---|---|---|---|---|
|


| Table of Contents | ||||
|---|---|---|---|---|
|
...