Pivot Reports represent your data in a table view with aggregating, grouping and analyzing using two metrics as row and column for your chart. This report type is extremely useful for issues of comparasing, summarizing, and counting a large amount of data.

Create a pivot report
Use Report Designer to create, configure and style gauge reports.
| Panel | ||
|---|---|---|
| ||
|
Configure a Report
Fill in these fields to configure your report in a way you want.
To configure a report, follow the steps below:
- On the Configure tab, specify the report dataset.
- Click Refresh to build the report.
- Click Save to save the report.
| Info |
|---|
Use the Condition Builder to establish additional conditions for data filtering and grouping. Click the icon 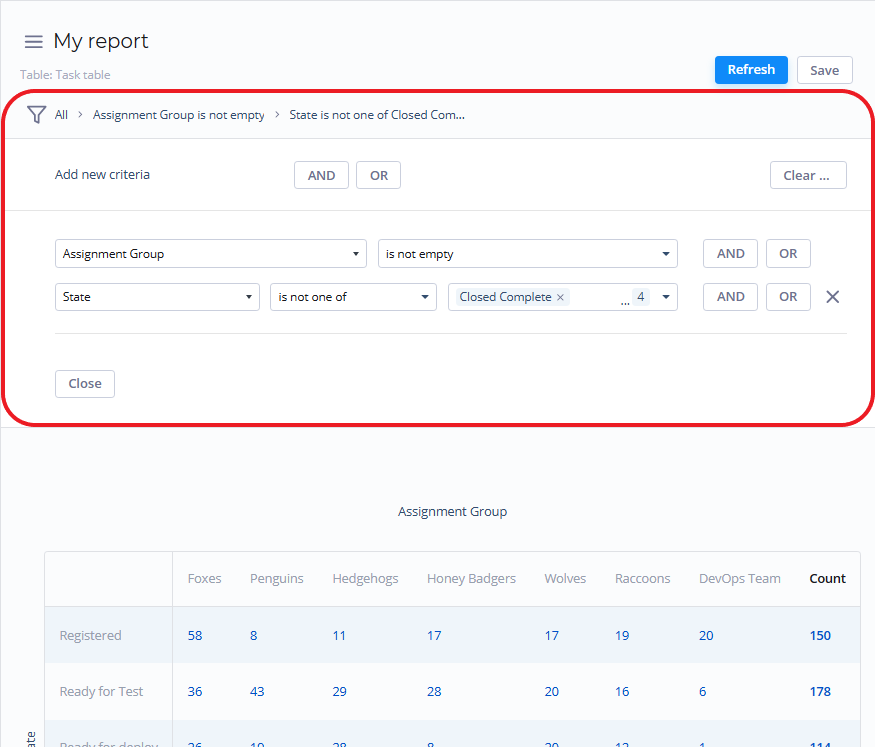 |
The Configure tab fields
| Field | Description |
|---|---|
| Row | Set a desired table column as a row for pivot report. |
| Column | Set a desired table column as a column for pivot report. |
| Aggregation type | Select a type of the numeric data aggregation from one of these options:
|
| Aggregation column | Select a table column with numeric values for data aggregation. |
| Groups limit | Set the limit of the data groups shown in your report with a particular number in this field. |
| Show rest as other | Set this checkbox on to show the data groups not included in Groups limit as one. |
Use the Condition Builder to establish additional conditions for your report data filtering and grouping.
Customize a Style
To customize a report style, follow the steps below:
- On the Style tab of your report, configure the Drilldown list layout
- setting.
- Click Refresh to apply the changes.
- Click Save to save the report.
| Table of Contents | ||
|---|---|---|
|