Make simple reports with digit representation of a single metric value.To create a Digits Report with the Report Designer, navigate to the Reports → Create a Report, and

Create a digit report
Use Report Designer to create, configure and style digit reports.
| Panel | ||
|---|---|---|
|
|
|
|
|
|
Configure a Report
To configure a report, follow the steps below:
- On the Configure tab, specify the report dataset.
- Click Refresh to build the report.
- Click Save to save the report.
| Info |
|---|
Use the Condition Builder to establish additional conditions for data filtering and grouping. Click the icon 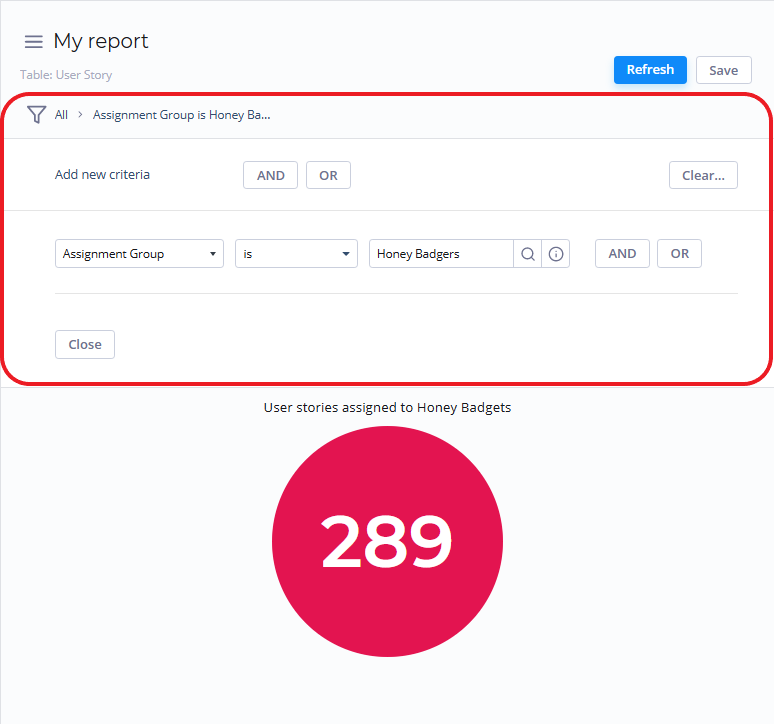 |
Fill in these fields to configure your report in a way you want.
The Configure tab fields
Field | Description |
|---|---|
| Aggregation type | Select a type of the numeric data aggregation from one of these options:
|
| Aggregation column | Select a table column with numeric values for data aggregation. |
Use the Condition Builder to establish additional conditions for your report data filtering and grouping.
Customize a Style
fhgfhCustomize a Style
You can configure the report look and digit score colors in any way you want with the style settings.
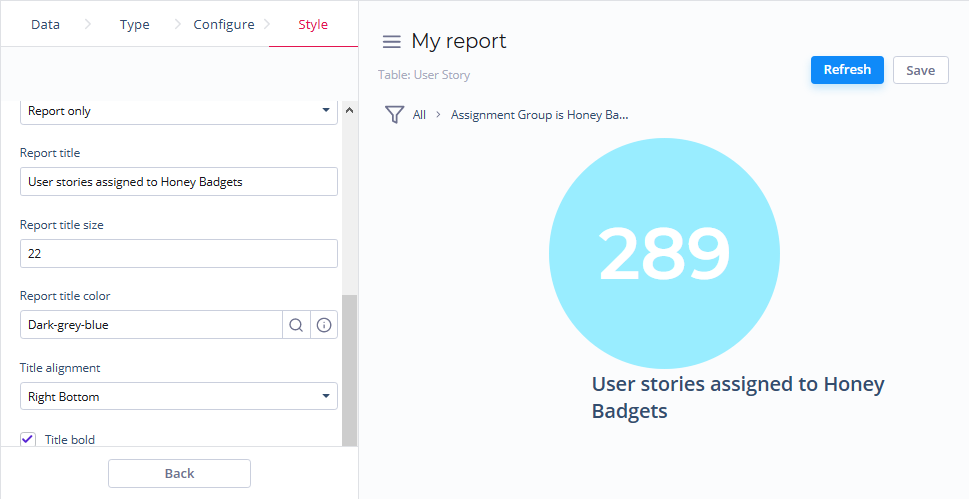
To customize a report style, follow the steps below:
- On the Style tab of your report, configure the settings.
- Click Refresh to apply the changes.
- Click Save to save the report.
Change colors, add titles and customize the data list and table views with the settings below.
The Style tab fields
| General Style | |
|---|---|
| Drilldown list layout | Select the list layout of the report data. |
| Decimal precision | Set the number defining how much numbers should be displayed after the point of numeric data values in your chart. |
| Title Style | |
| Report title show type | Set the type for the report title showing. Select one of the options:
|
| Report title | Enter the title of the report you create. |
| Report title size | Enter the number of points to set the size of the report title. |
| Report title color | Select the color of the report title. |
| Title horizontal alignment | Set the horizontal alignment of the chart title with one of the options:
|
| Title vertical alignment | Set the vertical alignment of the chart title with one of the options:
|
| Title bold | Switch this checkbox on to make the chart title bold. |
| Table of Contents | ||
|---|---|---|
|